


Serverwide Performance Benchmarking
Introduction
Background
Before installing a new shared Linux database- and webserver I wanted to get an idea of the real world performance of various filesystems combined with the noatime and atime flags. This article contains a brief analysis of the results of my testing.
To get a good idea of the relative impact of the chosen filesystem I also tuned the amount of shared buffers used in the PostgreSQL database software, which powers a number of sites on the server. On top of that, I also took a look at the benefit of using APC, the Advanced PHP Cache.
Test environment
All tests were run on the same hardware configuration, a spare HP NetServer LP1000r:
- Dual Pentium-III 1.13 GHz
- 3 Gb PC-133 SDRAM
- 2x 72 Gb 10K SCSI disks in RAID-1
The operating system of choice was Debian Linux 4.0r0 (etch) because of the proper kernel hardware support and its stability. The installed software packages for the test are basically Apache, PHP, PostgreSQL and MySQL, serving ten different virtual hosts with a few different CMSes and static content.
All tests were performed on an isolated network with a 100 Mb switch so the network wouldn't be a bottleneck when measuring throughput. Also, the client machine running the benchmarking software had enough processing power to pass each testing round without utilizing over 5% of its CPU time each second.
Test setup
I wanted to test all default filesystems supported by Debian Linux in the installer and I took special care to benchmark all three journalling modes of the Ext3 filesystem (note that ordered mode is used by default). In total this added up to six different filesystem configurations:
- Ext3 journal
- Ext3 ordered
- Ext3 writeback
- ReiserFS default
- JFS default
- XFS default
Per filesystem, I tried both enabling and disabling the noatime flag. This flag indicates whether or not a file's last access time should be written to disk on each access. In theory, atime (access time enabled) should perform worse than noatime since it causes a lot more disk I/O.
For each combination of filesystem and atime flags, I benchmarked three different sizes for PostgreSQL's shared buffers, varying from 1000 pages (default), via 3500 to 10000 pages. Note that each page equals 8 Kb by default so the actual shared buffer sizes are 8 Mb, 28 Mb and 80 Mb. For the last scenario I increased the kernel.max_shmsize to 128 Mb.
In total this amounts to (6 x 2 x 3 =) 36 benchmarking scenarios. Each scenario was benchmarked four times in a row, discarding each first run because of warmup and cold cache effects. All raw test run data is available in the benchmark PDF for this article.
In addition to the 36 standard scenarios I created six more based on the XFS filesystem combined with the APC PHP opcode cache to be able to see all benchmarking numbers in perspective.
Note that I fully reinstalled and reconfigured the system between filesystem changes for accuracy. Also, the filesystem and flags were only applied to the /var partition where the webserver data (/var/www), log-files (/var/log) and database storage (/var/lib) are kept.
About the benchmark
You might ask: what performance are you testing? The answer is I'm trying to test the full system's performance, measured in the number of actual HTTP requests per second. It's a mere coincidence that the resulting numbers come in just under 100, in no way do the given numbers indicate percentages.
For the benchmark itself, I wrote a multithreaded client program that can replay webserver logs in a concurrent fashion (concurrency was set to 25 simultaneous requests). For this test I used a partial real world log-file with 10000 URLs based on actual future usage of the server. And so the log-file entries were completely natural in order with no artificial sorting or filtering.
One word of advice, as with all benchmarks, is that you should take my measurements as a guideline and not as a hard, universal truth. Also, filesystem performance is partially implied by the level of data safety and integrity you get. Ext3 in journalling mode might not perform very well, but it does provide a much better safety net than others in case of a sudden power failure.
Benchmark Results
Filesystems and shared buffers
To start off with the most interesting and complete observations first, here is a chart comparing all filesystems with the atime flag set when used in conjunction with each of the three different PostgreSQL shared buffer sizes:
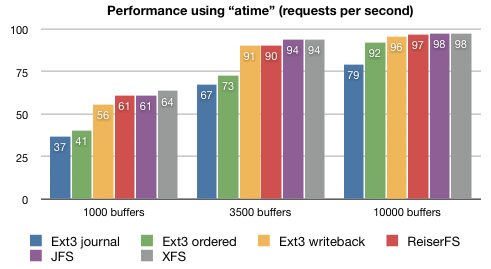
Filesystem "atime" comparison per number of PostgreSQL shared buffers.
Apparently the PostgreSQL shared buffer sizes makes a much more dramatic impact on the system performance than the chosen filesystem. Even the best performing filesystem (XFS) in the 1000 buffers setup performs worse than the slowest filesystem (Ext3 journalled) in the 3500 and 10000 buffers scenarios. Looking at XFS performance, tuning the shared buffers easily gives a 40 to 50% performance increase.
A closer inspection reveals that filesystems do differ in performance, but relatively little at that. Looking at the best (XFS) and worst (Ext3 journalled) performers in each category, the relative extra performance of XFS shrinks from 70% via 40% to 25% when increasing the number of shared PostgreSQL buffers.
Comparing XFS to Ext3 in the default ordered mode those numbers are even less, from 55% via 30% to 5%. The performance increase is almost negligible when comparing XFS to Ext3 in writeback mode, under 3% when using a sufficient number of shared buffers.
Remember that the above chart represents the measurements for each filesystem with the atime flag set. The conclusions are actually quite the same when using the noatime flag, as you can see in this second chart:
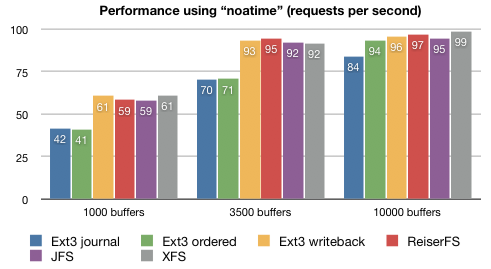
Filesystem "noatime" comparison per number of PostgreSQL shared buffers.
Again, the number of PostgreSQL shared buffers makes a large impact on throughput while the filesystem choice (except for Ext3 in journalled or ordered mode) makes relatively little difference. We'll now take a look at the comparison between atime and noatime.
atime and noatime
Here are two charts indicating the performance of the atime versus the noatime flag per filesystem. The first chart is using 1000 shared PostgreSQL buffers, the second one 3500. Another chart for 10000 shared buffers is included in the PDF for this article.
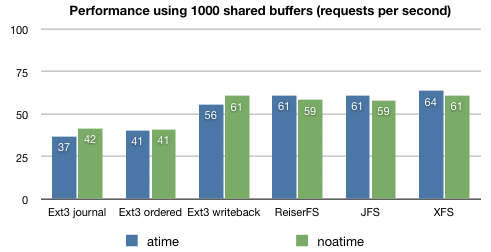
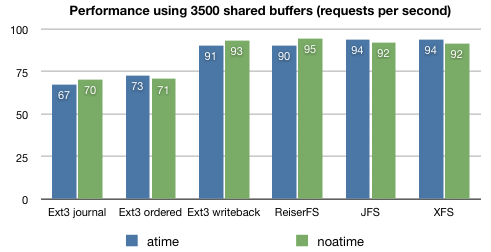
Comparison of "atime" versus "noatime" per filesystem with 1000 (top) and 3500 (bottom) PostgreSQL shared buffers.
These two charts indicate a problem with the benchmark data, as there is no consistent difference in performance between atime and noatime for all tested filesystems.
Comparing all three charts, the only observations one can make are that noatime consistently speeds up Ext3 journalled (by 5%) and writeback (by 2%) and consistently slows down JFS (by 3%). These numbers are based on the average of nine runs, but such small percentages can still be labeled as statistically insignificant.
APC PHP opcode cache
The following chart compares the XFS benchmark numbers against the XFS + APC benchmark:
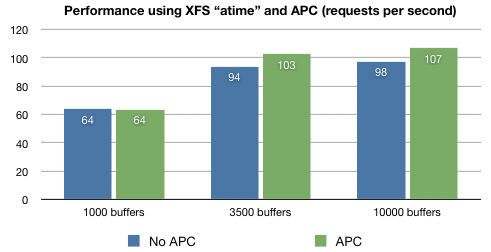
Comparing XFS without and with APC enabled.
Given a sufficient number of PostgreSQL shared buffers APC can give an extra performance boost of about 9%. Of course this number is heavily dependent on the amount and complexity of the PHP script you are using on your website(s). The CMSes for Forever For Now (this site) and my other hosted sites are fairly light on resources so you might see a much larger benefit from using APC.
Conclusions
In general
Based on my benchmark numbers I think there are a few statements that can be labeled "conclusions":
- Tuning your database performance parameters is the best way to improve overall system throughput on a shared database and webserver.
- Except for the data-integrity focused filesystems like Ext3 in journalled or ordered mode, filesystem performance is pretty much not a major factor contributing to database and webserver throughput.
- Enabling noatime does not make a big (over 5%) impact on filesystem performance for typical database and webserver loads.
- APC can give a measurable performance boost in PHP script processing, of course largely depending on the size of your scripts.
While performing the benchmark I noticed that an insufficient amount of PostgreSQL shared buffers causes a lot of CPU system-time (see vmstat or top). An improperly tuned setup will easily use more than 20% of sys-time while after tuning that number is reduced to less than 5%.
Please keep in mind that this benchmark was about a shared database and webserver. Typical dedicated database or webservers might exhibit different performance characteristics.
About this article
I hope this benchmark article was helpful to you, questions and comments are always welcome via e-mail. Please make sure to read the full benchmark PDF with all raw data and more charts.
This article was added to the site on the 19th of September, 2007.