


UML Diagrams Using Graphviz Dot
Introduction
Background
This article is about using the dot tool from the Graphviz package to automatically generate UML diagrams on the fly. We'll take a look at modelling packages, classes, attributes, methods and associations which already covers a fair subset of the class diagrams in UML.
Of course, the information given in this article is only of limited use in situations where you are manually entering the graph description, but the information is highly useful when you're writing a tool which analyzes program structure. So read on if you're writing a piece of software like UMLGraph.
Getting Started
What you need
First of all, you need to have the Graphviz package installed on your computer, head over to the Graphviz website to download a version for your operating system. Windows users can find binary installers there, Linux users should simply use their package manager since graphviz is a common piece of software. For other Unices, you should download and compile the source code.
There aren't many other prerequisites, but it helps if you've got a good example scenario to start with. In this article I'll be using a somewhat contrived and artificial example, but I hope it gets the point through. You might also want to make sure you have the Bitstream Vera family of fonts installed as I will be using these throughout the article.
The so-called "problem"
The example will be based on a small portion of an animal inspired domain. We'll model a simple Animal superclass which will have two subclasses: Dog and Cat. Animal will have some attributes and methods and both Dog and Cat will add another method to the mix.
We'll model an association between Dog and Cat which resembles an arch-enemy relation. This relation will be of an N:M multiplicity. Besides this, the Animal class will be in the default package, while both Dog and Cat are placed in a package called "animal.impl".
So, fire up a text editor and let's type away.
Graphing Basics
General properties
Let's start off by writing the boilerplate for the dot tool:
digraph G {
        fontname = "Bitstream Vera Sans"
        fontsize = 8

        node [
                fontname = "Bitstream Vera Sans"
                fontsize = 8
                shape = "record"
        ]

        edge [
                fontname = "Bitstream Vera Sans"
                fontsize = 8
        ]
Don't worry if you don't get this immediately. The first line tells dot we want to draw a directed graph, or digraph for short. A directed graph is a graph in which all edges point from one node to another node, each edge has a start and end node.
The second and third lines set the font properties for the graph, as you can see the next few lines set the font properties for the default nodes and edges as well. There's one line of interest which isn't covered yet, it's the one defining the shape property for nodes.
We set the shape to record because the record shape allows a node to be separated using bars. As we'll see later on, this is the perfect way to model an UML class diagram.
Modelling the Animal class
Let's model the Animal class, which will have a public "name" and "age" property and a public method called "die()". As I stated earlier, this example is somewhat artificial, but it works. I modelled the Animal class like this:
        Animal [
                label = "{Animal|+ name : string\l+ age : int\l|+ die() : void\l}"
        ]
If you're not familiar with the dot syntax, it will look awkward to you. But let's look at what this class looks like after using dot:
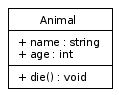
The basic Animal class example generated by dot.
Seeing this should give you an idea about how the dot syntax works.
Why the Animal class looks like this
The label property we've set for the Animal node does a few things:
- The opening and closing curly braces "{" and "}" indicate that we want to create a "record" shape with multiple dividers.
- The pipe characters "|" indicate the dividers, we use one to separate the class name from the attributes and another one to separate the methods from the attributes.
- Putting the "\l" characters after a line of text indicates the line should be aligned to the left side of the shape and that a new line of text should start.
Trying it for yourself
To generate the Animal example yourself, copy and paste the following code in a file called "class.dot":
digraph G {
        fontname = "Bitstream Vera Sans"
        fontsize = 8

        node [
                fontname = "Bitstream Vera Sans"
                fontsize = 8
                shape = "record"
        ]

        edge [
                fontname = "Bitstream Vera Sans"
                fontsize = 8
        ]

        Animal [
                label = "{Animal|+ name : string\l+ age : int\l|+ die() : void\l}"
        ]
}
Now, open a terminal in the directory you've created this file and call the dot tool like this:
dot -T png -o class.png class.dot
This will generate a PNG file with the Animal class model in it. For the rest of the article, I will assume that you can add closing braces yourself, so I won't give you the full code for each example anymore.
Futher Modelling
Creating the Dog and Cat classes
The Dog and Cat classes are actually quite simple once you've seen the Animal class. Add the following lines after the Animal class and before the closing curly brace:
        Dog [
                label = "{Dog||+ bark() : void\l}"
        ]

        Cat [
                label = "{Cat||+ meow() : void\l}"
        ]
If you run dot on the resulting file, you'll see the three classes without any associations or relations between them:
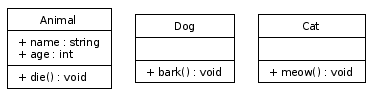
The three classes: Animal, Dog and Cat.
Modelling the subclass relation
Dog and Cat should be subclasses of Animal. Let's add two lines originating from Dog and Cat and ending at the Animal class with an empty arrowhead, UML's way of expresing a subclass relation. Enter the following lines after the Cat declaration, but before the ending curly brace:
        edge [
                arrowhead = "empty"
        ]

        Dog -> Animal
        Cat -> Animal
You can see the arrowhead being set to "empty" in the second line. The lines with "->" in them describe the directed relations. Dog points to Animal, Cat points to Animal: both subclass relationships are defined in those lines. Using dot, the UML diagram now looks like this:
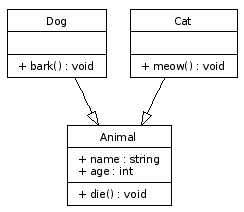
The three classes and the subclass relations are now modelled.
Modelling the "arch-enemy" association
Let's add the N:M relationship between Dog and Cat. I used the following lines in my dot file, enter these after the subclass relation lines but before the closing curly brace:
        edge [
                arrowhead = "none"

                headlabel = "0..*"
                taillabel = "0..*"
        ]

        Dog -> Cat
The second line disables the arrowhead, necessary because association do not exhibit a graphival direction. The "headlabel" and "taillabel" values describe the texts shown at the beginning and end of the edge. In the case of a N:M relation, both of these labels should read "0..*". The last line adds an edge between the Dog and Cat class. After running dot, the result is this:
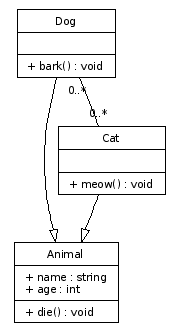
The arch-enemy association between Dog and Cat is now modelled.
Modelling the package
Adding the package to the mix is a bit more complicated, you'll need to add two lines before the declaration of the Dog class:
        subgraph clusterAnimalImpl {
                label = "Package animal.impl"
Add a closing brace "}" just below the Cat class declaration.
The first line tells dot that the coming nodes are to be clustered together in a box. The second line describes the label of the box. The name of the subgraph is very important: only subgraphs having a name starting with "cluster" are drawn together inside a box.
Conclusion
The end result
The resulting dot file should look like this:
digraph G {
        fontname = "Bitstream Vera Sans"
        fontsize = 8

        node [
                fontname = "Bitstream Vera Sans"
                fontsize = 8
                shape = "record"
        ]

        edge [
                fontname = "Bitstream Vera Sans"
                fontsize = 8
        ]

        Animal [
                label = "{Animal|+ name : string\l+ age : int\l|+ die() : void\l}"
        ]

        subgraph clusterAnimalImpl {
                label = "Package animal.impl"

                Dog [
                        label = "{Dog||+ bark() : void\l}"
                ]

                Cat [
                        label = "{Cat||+ meow() : void\l}"
                ]
        }

        edge [
                arrowhead = "empty"
        ]

        Dog -> Animal
        Cat -> Animal

        edge [
                arrowhead = "none"

                headlabel = "0..*"
                taillabel = "0..*"
        ]

        Dog -> Cat
}
Running this file through dot gives the following UML diagram:
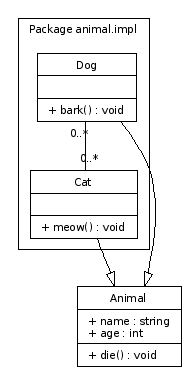
The end result of our dot modelling work.
Further ideas
I hope this article provided a good starting point for drawing UML diagrams automatically using dot. See the UMLGraph website for more ideas on implementing extensions to the basic ideas. I hope you found this information useful.
About this article
This article was added to the site on the 1st of April 2006.